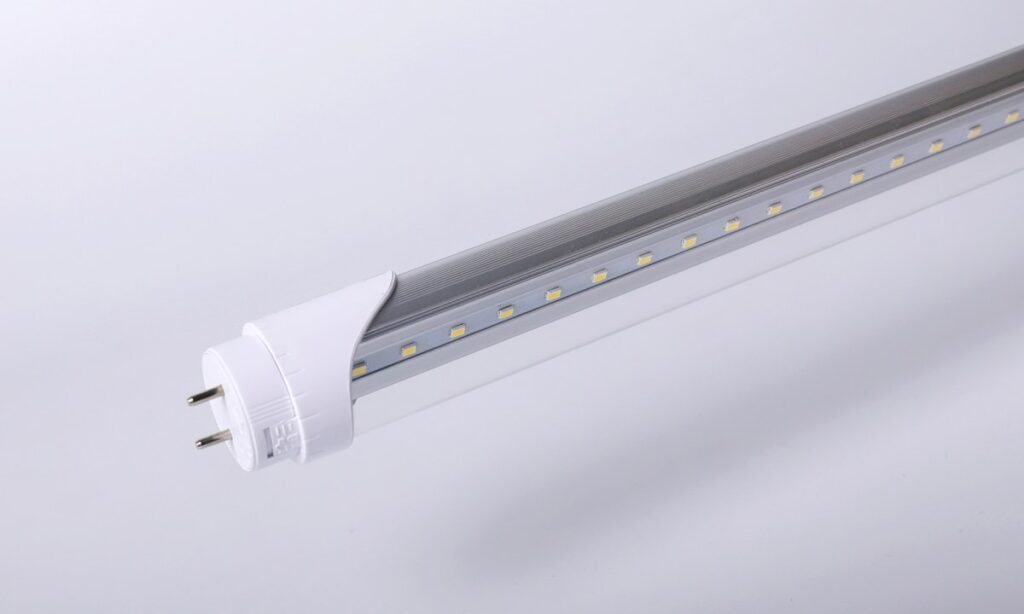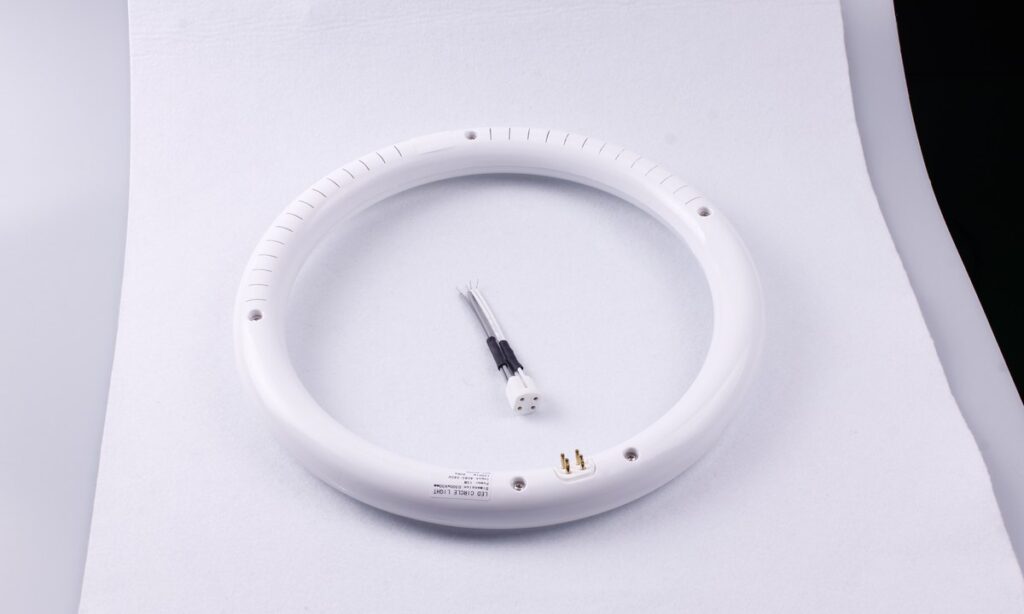


A T9 circular LED lamp is a ring-shaped source, but that shape alone does not guarantee even light in every direction. The installed result depends on LED orientation, diffuser transmission, ring dimensions, driver and connector interruptions, the host reflector or lens, mounting height and room geometry. For replacement decisions, compare the complete fixture with photometric data and an application-level illuminance grid; do not accept one beam-angle number as a substitute for distribution evidence.
Start with the Exact Lamp and Fixture
Record the lamp model, rated power, outer and inner diameter, tube diameter, base, electrical configuration and selected CCT. Then document the fixture housing, reflector, lens, mounting height and task area. Two rings that both fit a G10q holder can produce different results because the emitting surfaces and optical materials are different.
The current New Lights 3-CCT T9 page identifies a 30 mm PC body, a G10q four-pin connection and selectable 3000 K, 4000 K and 6500 K states for the New Lights 3-CCT LED T9 Circular Lamp. The product family includes four ring sizes from 9 W to 24 W. Match the exact diameter, holder position and input version before evaluating its optics.
| Item to identify | Evidence to request | Decision it supports |
|---|---|---|
| Ring and tube dimensions | Dimensioned drawing and sample measurement | Physical fit, reflector clearance and visible source position |
| Emitting direction | Board orientation, diffuser section and product photograph | Whether light travels mainly forward, sideways or toward the reflector |
| Electrical version | Wiring diagram, input marking and instructions | Safe compatibility with the existing fixture |
| CCT state | Switch position and test-report coverage | Whether measured output represents the sold configuration |
| Host optics | Reflector finish, lens type and condition | How bare-lamp output becomes fixture output |
The FC12T9 LED replacement guide owns the detailed fit and wiring checklist. This guide focuses on what happens after a compatible lamp is identified: how to determine whether its light reaches the required surfaces in the required pattern.
Understand What Beam Angle Can and Cannot Tell You
Beam angle is most useful when a source has one clear optical axis and one dominant intensity peak. It is commonly derived from directions where luminous intensity falls to a defined proportion of the maximum. A spot lamp may therefore be described reasonably well by one number.
A circular lamp can behave differently. Its polar plot may be broad, annular, multi-lobed or asymmetric. The connector, driver, supports and LED-board layout may interrupt rotational symmetry. If maximum intensity appears away from the central axis, a single beam-angle value can conceal the shape that matters.
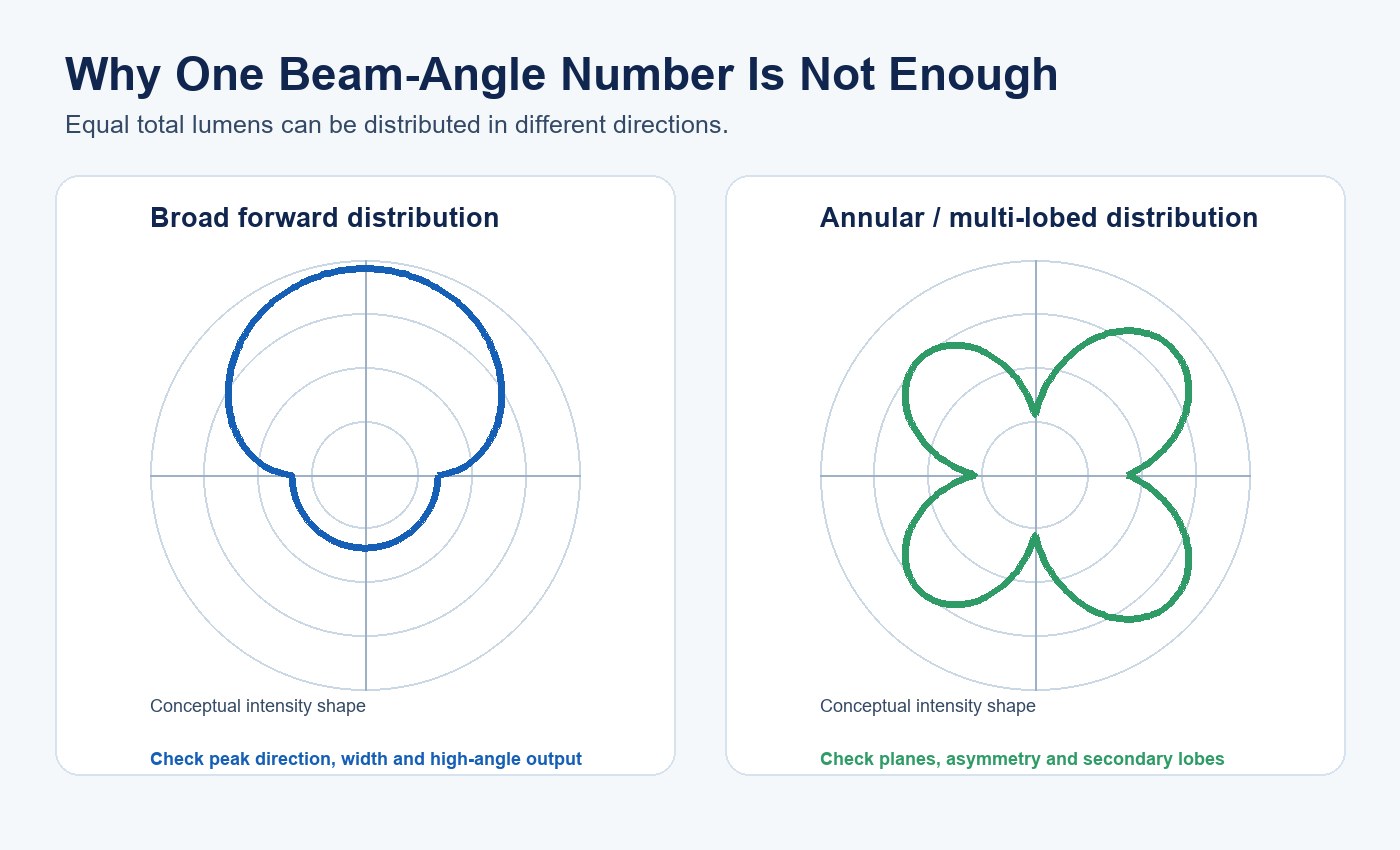
Ask how the reported angle was defined, which measurement plane was used and whether the value refers to the bare lamp or complete fixture. If different vertical planes produce materially different curves, compare all relevant planes rather than selecting the most favorable one.
Read the Photometric Report as a Set
DOE guidance on LM-79 reports describes measurements including total luminous flux and luminous intensity distribution. These quantities answer different questions. Lumens indicate total emitted light; candelas describe intensity in a direction; zonal lumens group flux by angular region. A useful comparison keeps them together.
| Report element | What it shows | What it does not establish alone |
|---|---|---|
| Total lumens | Total emitted luminous flux | Where the light goes |
| Polar intensity plot | Intensity by angle in one or more planes | Illuminance on every project surface |
| Candela table | Numerical intensity at defined angles | Fixture losses or room reflections unless the complete fixture was tested |
| Zonal lumens | Flux within angular bands | Visual comfort or uniformity at the task |
| Input watts | Electrical demand during the test | Optical equivalence or delivered light |
| CCT and CRI | Color appearance and color-rendering data | Distribution, glare or compatibility |
Check the test sample, orientation, stabilization condition, electrical input and CCT state. A report for one ring size or switch position should not automatically be applied to every version in a family. Retain the numerical photometric file when available so the proposed fixture can be evaluated in a lighting calculation rather than only by looking at a PDF image.
Separate Bare-Lamp, Fixture and Application Results
The distribution reaching the room is produced by a chain. The bare lamp emits light; the fixture reflector and lens redirect or absorb it; spacing, mounting height and room surfaces determine illuminance and uniformity. Each boundary needs its own evidence.
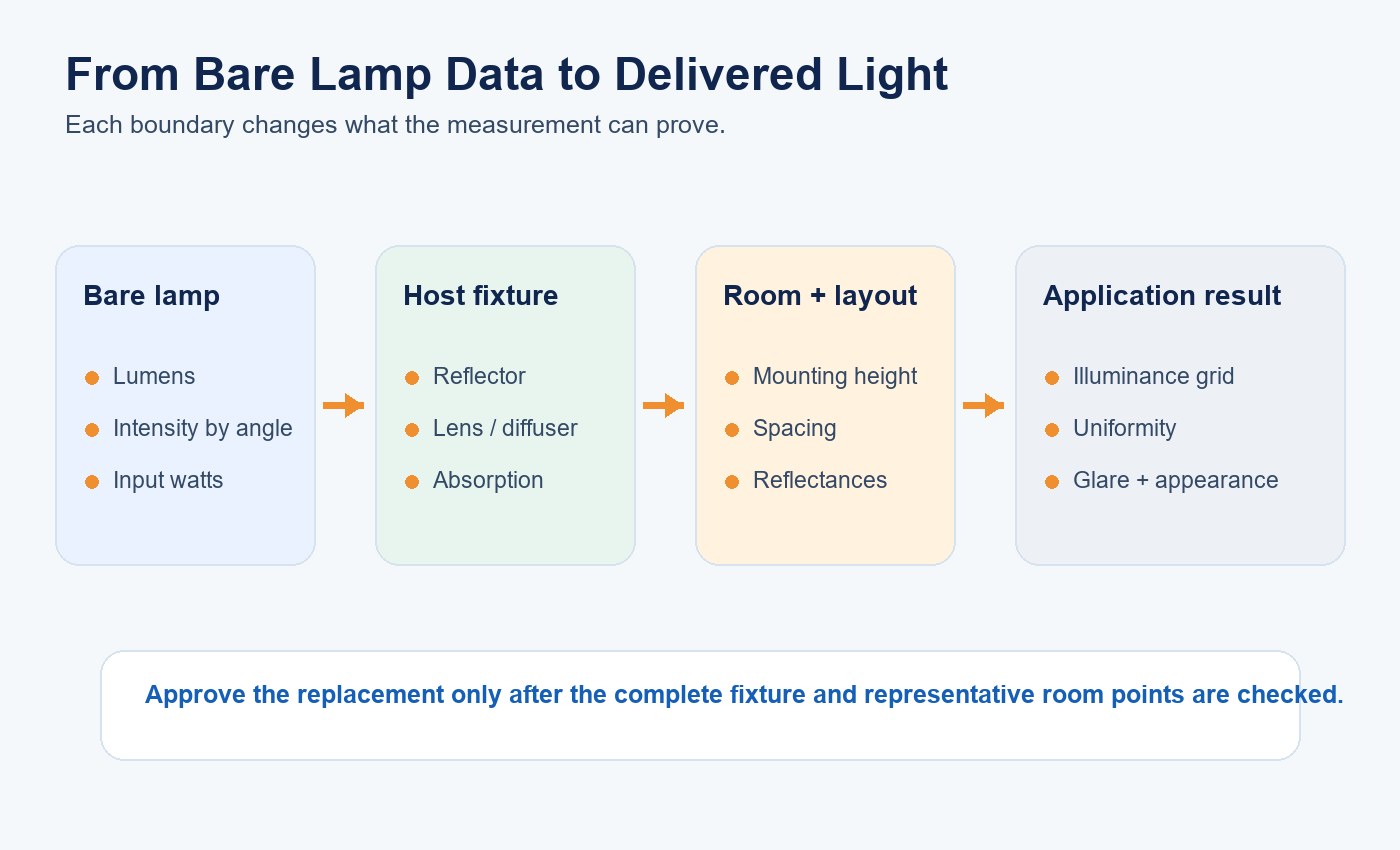
The fixture may use a white cavity, polished reflector, opal lens or decorative cover. Side and backward emission can be useful when a reflector redirects it, but the same flux can be lost in a dark or dirty cavity. A directional LED ring may raise direct illuminance while making the diffuser less uniform. This is why equal lamp lumens do not guarantee equal fixture lumens or an equivalent room result.
The same principle appears in the prismatic-lens uniformity guide: diffusion can improve apparent uniformity while introducing transmission losses and changing high-angle intensity. Treat the optical system as a whole.
Compare the Existing and Proposed Systems Fairly
Establish the existing system as a measured baseline before replacement. Record the lamp age, ballast or driver state, lens cleanliness and supply condition. Clean or dirty conditions must be stated because they can materially change the comparison.
DOE guidance on LED equivalency emphasizes total output together with similar distribution. For a circular-lamp retrofit, compare the existing and proposed complete fixtures at equivalent operating conditions. If only bare-lamp data exist, classify the conclusion as preliminary and require a representative mockup.
| Comparison level | Minimum evidence | Acceptance question |
|---|---|---|
| Mechanical | Drawing, holder position and installed photograph | Does it fit without stressing the ring or blocking the diffuser? |
| Electrical | Input type, wiring, power, controls and emergency behavior | Does it operate safely in every required mode? |
| Lamp photometry | Lumens, intensity distribution and CCT-state coverage | Is the source evidence complete and comparable? |
| Fixture photometry | Complete-fixture lumens and distribution | How do the reflector and lens change the result? |
| Application | Illuminance grid, uniformity and visual review | Are target surfaces and viewing conditions acceptable? |
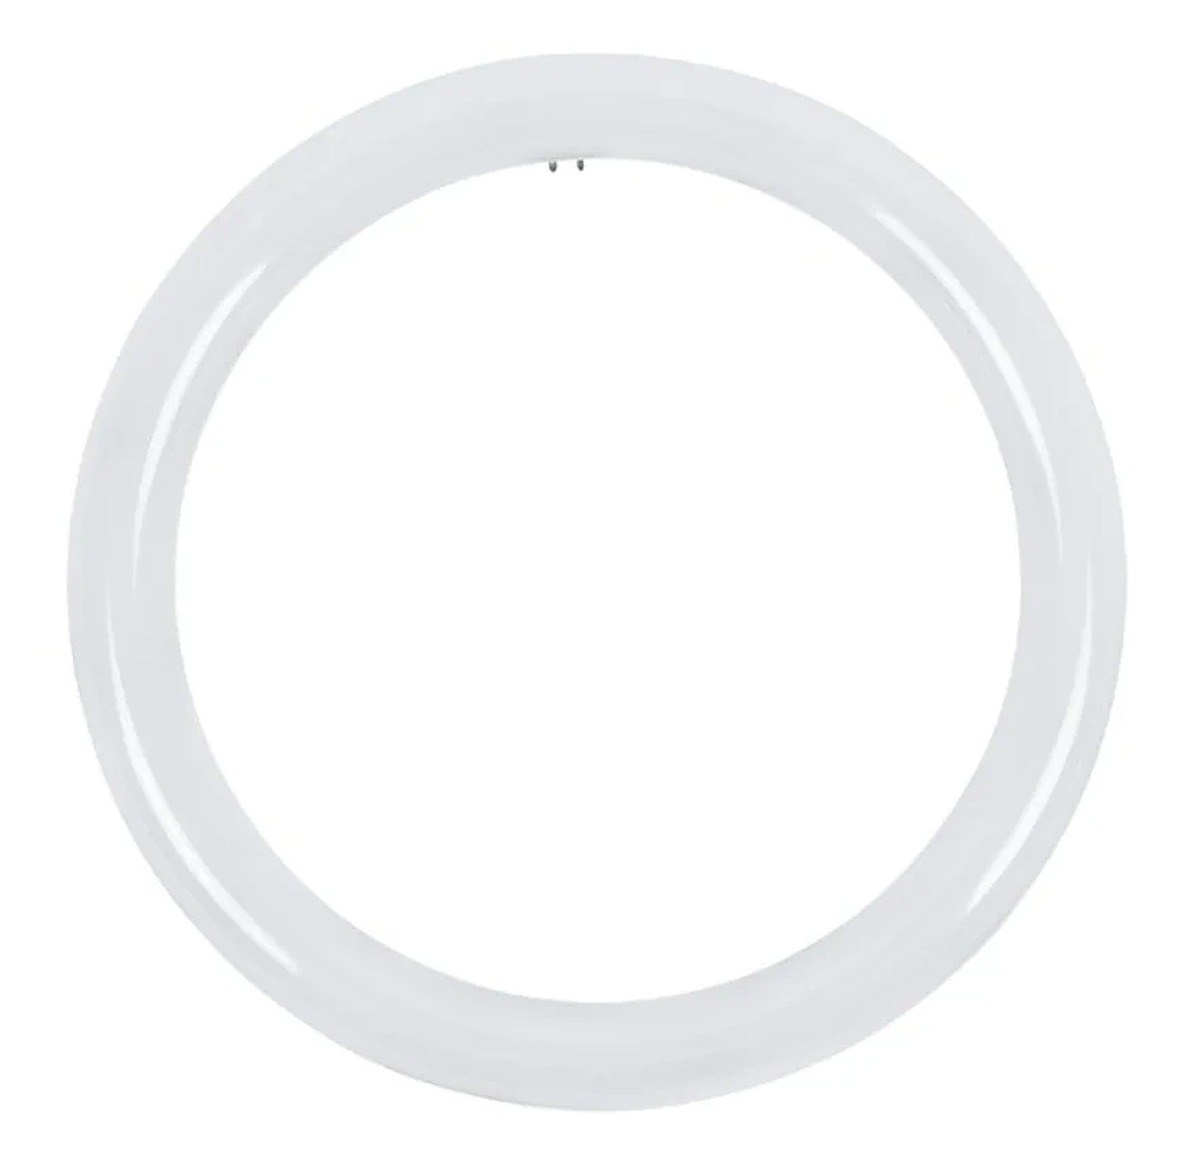
When comparing with a circular fluorescent baseline, verify that the correct lamp family and electrical system are represented. The GR10Q T9 circular fluorescent lamp is a useful product-family reference, but the exact baseline must still be identified from the installed marking and circuit.
Measure Illuminance and Uniformity on the Relevant Surfaces
Create a measurement grid before installing the replacement. Include the work plane, floor, walls, shelves or signs that matter to the application. Keep the grid, meter position, mounting height and room condition unchanged between tests. Define those requirements before product comparison; the LED lighting project planning guide provides the broader application checklist.
Record average, minimum and maximum illuminance and the project’s required uniformity ratio. The average can remain acceptable while the perimeter becomes darker, or the minimum can improve while a bright center raises glare. Include vertical illuminance where faces, displays or wall brightness affect the task.
Use lighting-calculation software when a verified photometric file and a representative room model are available. Then validate the model with field measurements. Calculation and measurement should agree within a stated tolerance appropriate to the project; investigate differences in mounting, reflectance, photometry or measurement method rather than adjusting the model without explanation.
Inspect Visual Uniformity, Shadows and Glare
Photometric values do not replace visual inspection. View the fixture from normal standing, seated and approach angles. Look for visible LED points, bright arcs, a dark connector sector, ring-shaped shadows, center hot spots and uneven lens brightness.
Wide distribution is not automatically low glare. Glare depends on source luminance, apparent size, high-angle intensity, background luminance and viewing position. A brighter exposed ring can feel uncomfortable even when the beam is broad. If a project has a formal glare criterion, evaluate it using the applicable luminaire and room data rather than substituting a beam-angle claim.
Photograph before and after conditions using fixed exposure, white balance, camera position and lens. These images support visual comparison, but the illuminance grid and photometric file remain the quantitative record.
Check Every Sold CCT and Operating State
Selectable-CCT products can use different LED-channel combinations. Confirm whether one report covers all switch states and ring sizes. Measure input power, lumen output, intensity distribution, CCT, color quality and temporal light modulation for each state required by the project.
Set and record the CCT before installation according to the instructions. Do not change a selector while energized unless the product documentation permits it. If controls, emergency circuits or reduced-power states are required, test their distribution and output separately because they can change the delivered-light result.
The LED tube versus fluorescent tube guide explains the broader difference between replacement-lamp and legacy-system evaluation. The same discipline applies here: compatibility, output, distribution and operating behavior must be compared as separate questions.
Run a Representative Mockup
Choose fixtures that represent each reflector, lens, diameter, wiring method, mounting height and room condition. Include difficult locations, not only the cleanest fixture. Test more than one lamp so that one favorable sample does not determine the project decision.
- Record the existing lamp, electrical system and fixture condition.
- Measure input power and the agreed illuminance grid after stabilization.
- Photograph the lens and application from fixed positions.
- Install the exact proposed model using the approved wiring method.
- Repeat power, photometric and visual checks at every required CCT state.
- Compare results against stated acceptance limits and document exceptions.
| Result | Likely next action |
|---|---|
| Fit and electrical checks fail | Stop; select a compatible model or approved conversion route |
| Lumens are similar but perimeter light falls | Review distribution, reflector interaction, spacing or mounting height |
| Grid passes but lens shows bright arcs | Review diffuser, source position and normal viewing angles |
| One CCT state differs materially | Obtain state-specific evidence or restrict the approved setting |
| Representative fixtures vary widely | Segment the project by fixture family instead of forcing one replacement |
Build the Supplier RFQ Around Decisions
Send the installed lamp marking, fixture photographs, dimensions, reflector and lens details, mounting height, room geometry, target illuminance, uniformity criterion, viewing conditions and required controls. Ask for the exact model and revision, dimensions, wiring instructions, input data, photometric report, numerical intensity file, CCT-state coverage and sample-identification method.
For production control, connect the approved sample, drawings, optical materials and photometric file to one revision. A diffuser resin, surface finish, LED-board position or component substitution can change distribution even when the model name stays the same. New Lights’ factory and manufacturing capabilities provide a route for sample control and production coordination.
For a bounded review, contact New Lights with the fixture, baseline measurements and required optical evidence. The goal is a decision that can be repeated across the project, not a favorable photograph of one installation.
Frequently Asked Questions
Does a circular lamp automatically distribute light evenly?
No. LED orientation, diffuser design, connector interruptions and fixture optics can create directional, asymmetric or multi-lobed output.
Can equal lumens prove an equivalent replacement?
No. Equal lumens can still produce different fixture efficiency, intensity distribution, illuminance and uniformity.
Is one beam-angle value enough for a T9 circular LED lamp?
Usually not. Review the intensity plot, numerical data, relevant measurement planes and whether the value represents the bare lamp or complete fixture.
Should the lamp or the complete fixture be photometrically tested?
Bare-lamp data help compare sources, but complete-fixture data are needed when the reflector and lens materially affect distribution. A representative application mockup verifies the final result.
Can one photometric report cover every selectable CCT state?
Only when the report scope identifies those states and the product evidence shows that the measured configuration represents them. Otherwise request or measure state-specific results.
Editorial Sources
- New Lights, “3-CCT LED T9 Circular Lamps”: https://new-lights.com/products/led-tube-lights/specialty-led-tubes/led-t9-circular-lamp-3cct/
- U.S. Department of Energy, “Establishing LED Equivalency”: https://www1.eere.energy.gov/buildings/publications/pdfs/ssl/establishing-led-equivalency.pdf
- U.S. Department of Energy, “Understanding LM-79 Reports”: https://betterbuildingssolutioncenter.energy.gov/sites/default/files/attachments/understanding_lm79_reports.pdf